
ElastiFlowでsFlowの可視化をする

SELinuxの対応が不足していたため追記しました。
こんにちは、tukapiyoです。
今回は、おうちのネットワークのトラフィックを可視化していきたいと思います。
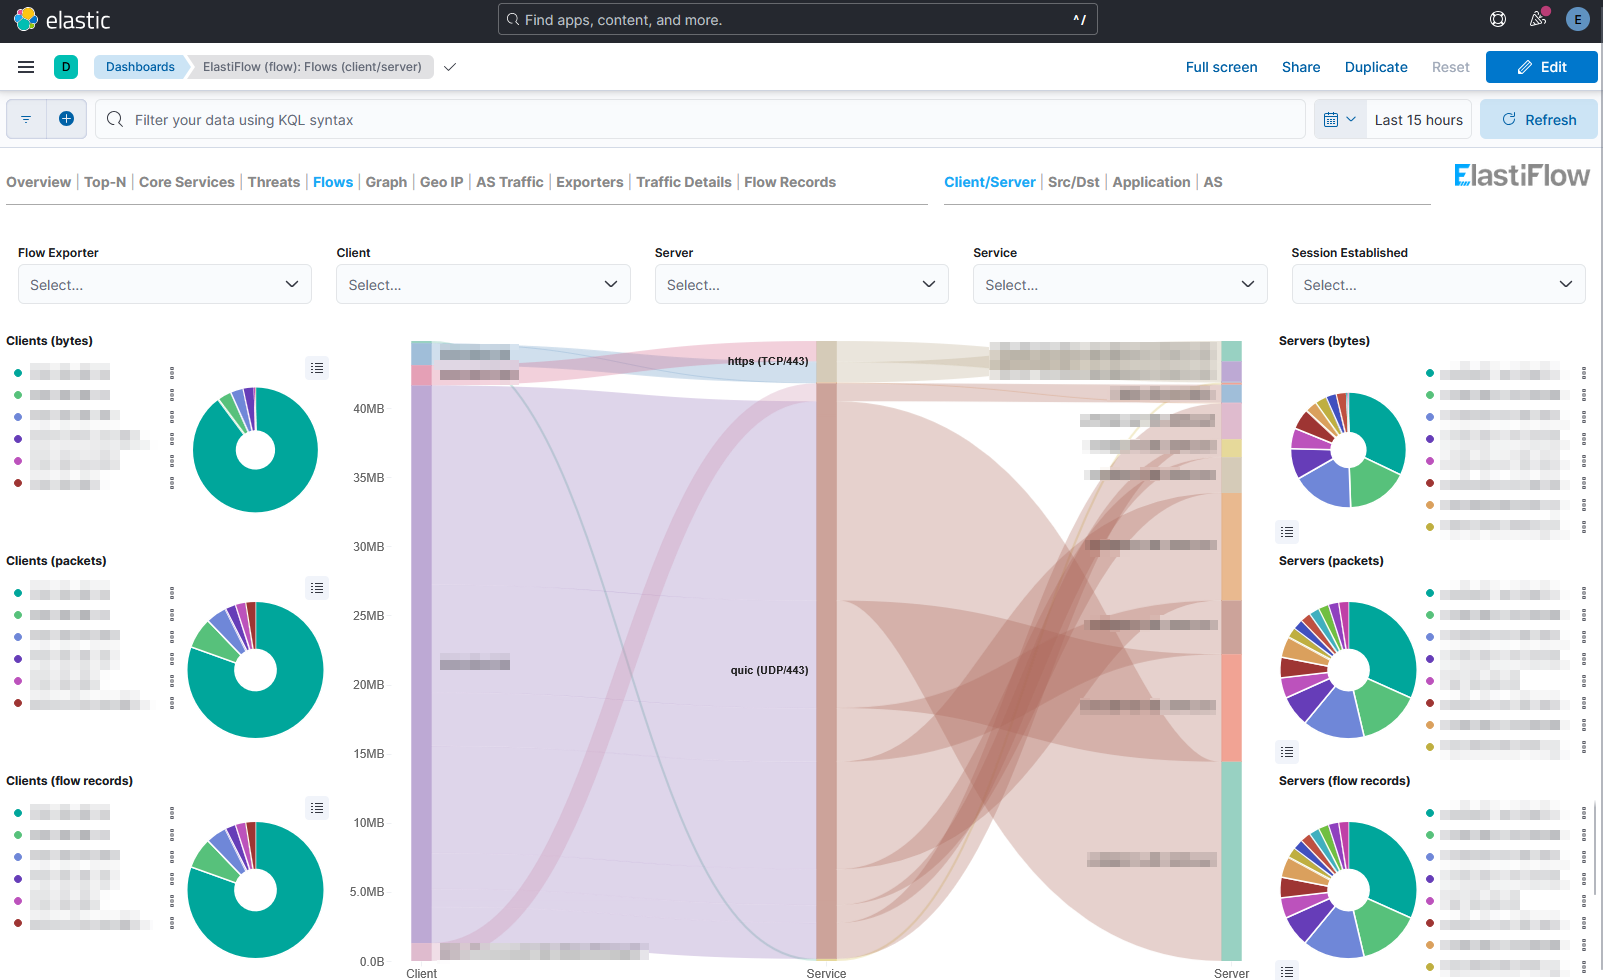
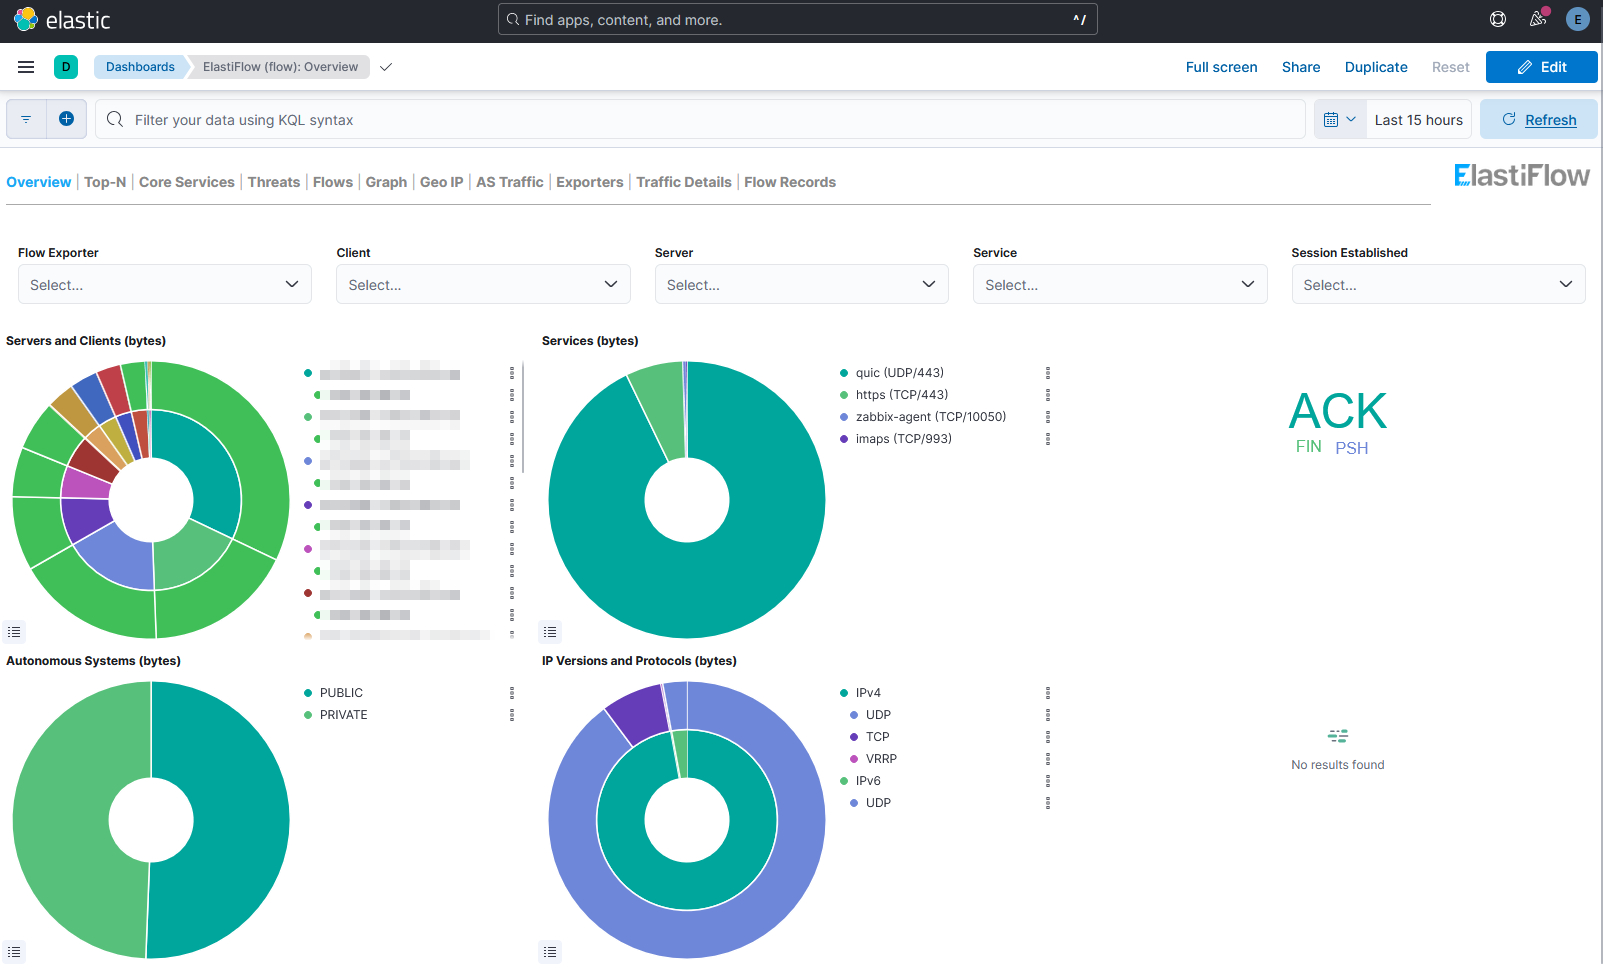
こんな感じ可視化していきます。
目次
導入するツールについて
利用するツールは、ELK Stack(Elasticsearch, Logstash, Kibana)にアドオンする形で利用できるElastiFlowです。
ElastiFlow自体は、ELK Stack以外のツールにもアドオンできるようですが、今回は私が利用経験のあるELK Stackをベースにします。
また導入の容易さのため、Dockerを利用して構築します。
ElastiFlowのライセンスは無料で利用できるBasicライセンスを使用します。
上記のサイトでは登録が必要かのように見えますが、ドキュメントの手順の通りやれば登録なく利用可能でした。
導入環境
- Red Hat Enterprise Linux 9.5 (Plow)
- Docker Community Edition 28
- SELinux有効
- Elasticsearch 8.16.4
- Kibana 8.16.4
- ElastiFlow 7.7.2
DockerはRed Hatが公式で提供するDocker互換のpodmanではなく、Docker公式のパッケージを利用します。
導入手順
Docker
以下のウェブページに沿って実施します。
Dockerリポジトリの導入とパッケージのインストール
$ sudo su -
# dnf config-manager --add-repo https://download.docker.com/linux/rhel/docker-ce.repo
# restorecon -Fv /etc/yum.repos.d/docker-ce.repo
# dnf install docker-ce docker-ce-cli containerd.io docker-buildx-plugin docker-compose-plugin
# systemctl enable --now docker
# systemctl disable --now firewalld
3行目では、docker-ce.repoのSELinuxコンテキストの修正をしています。
関係ないですが、サーバはファイアウォールの内側にいるので、firewalldをついでに停止しておきます。
Dockerの動作確認
# docker run hello-world
Unable to find image 'hello-world:latest' locally
latest: Pulling from library/hello-world
e6590344b1a5: Pull complete
Digest: sha256:c41088499908a59aae84b0a49c70e86f4731e588a737f1637e73c8c09d995654
Status: Downloaded newer image for hello-world:latest

Hello from Docker!
This message shows that your installation appears to be working correctly.

To generate this message, Docker took the following steps:
 1. The Docker client contacted the Docker daemon.
 2. The Docker daemon pulled the "hello-world" image from the Docker Hub.
    (amd64)
 3. The Docker daemon created a new container from that image which runs the
    executable that produces the output you are currently reading.
 4. The Docker daemon streamed that output to the Docker client, which sent it
    to your terminal.

To try something more ambitious, you can run an Ubuntu container with:
 $ docker run -it ubuntu bash

Share images, automate workflows, and more with a free Docker ID:
 https://hub.docker.com/

For more examples and ideas, visit:
 https://docs.docker.com/get-started/
上記のように、Hello from Docker!と言われれば成功です。
動作確認できたら、不要なコンテナを削除しておきましょう。
# docker ps -a
CONTAINER ID   IMAGE         COMMAND    CREATED         STATUS                     PORTS     NAMES
2b77cdb1035b   hello-world   "/hello"   4 minutes ago   Exited (0) 4 minutes ago             reverent_wilson
# docker rm 2b77cdb1035b
# docker images
REPOSITORY    TAG       IMAGE ID       CREATED        SIZE
hello-world   latest    74cc54e27dc4   2 months ago   10.1kB
# docker rmi hello-world
DockerでSElinux有効化
DockerでSELinuxが適切に動作するように、サービスの起動パラメータを修正します。
docker.serviceファイルのExecStart末尾に、--selinux-enabledを付与します。
# vim /usr/lib/systemd/system/docker.service
ExecStart=/usr/bin/dockerd -H fd:// --containerd=/run/containerd/containerd.sock --selinux-enabled

# systemctl daemon-reload
# systemctl restart docker
ElastiFlow+ELK Stack
以下のウェブページに沿って対応しますが、Ubuntu前提の手順となっているため、RHEL向けに一部変更が必要でした。
カーネルパラメータの設定
環境によって値は異なるでしょうが、今回はドキュメントの通り設定します。
# vim /etc/sysctl.d/elasticsearch.conf
vm.max_map_count=262144
# vim /etc/sysctl.d/elastiflow.conf
net.core.netdev_max_backlog=4096
net.core.rmem_default=262144
net.core.rmem_max=67108864
net.ipv4.udp_rmem_min=131072
net.ipv4.udp_mem=2097152 4194304 8388608
# sysctl -p /etc/sysctl.d/elasticsearch.conf
# sysctl -p /etc/sysctl.d/elastiflow.conf
Dockerの設定
こちらも環境によって値は異なるでしょうが、今回はドキュメントの通り設定します。
# vim /etc/docker/daemon.json
{
  "default-ulimits": {
    "memlock": {
      "name": "memlock",
      "soft": -1,
      "hard": -1
    }
  },
  "log-driver": "json-file",
  "log-opts": {
    "max-size": "10m",
    "max-file": "3"
  }
}
# systemctl restart docker
Docker Compose用ファイルのダウンロード
Docker Compose用の設定ファイルをダウンロードします。
# mkdir ~/elastiflow
# cd ~/elastiflow
# wget "https://raw.githubusercontent.com/elastiflow/ElastiFlow-Tools/main/docker_install/.env"
# wget "https://raw.githubusercontent.com/elastiflow/ElastiFlow-Tools/main/docker_install/elasticsearch_kibana_compose.yml"
# wget "https://raw.githubusercontent.com/elastiflow/ElastiFlow-Tools/main/docker_install/elastiflow_flow_compose.yml"
flow-collectorパッケージのダウンロード
flow-collectorのRHEL用のrpmパッケージをダウンロードし、中身の一部を展開します。
flow-collectorの設定ファイルをホスト側に保存しておくことで、コンテナを再作成しても設定を永続化できるようになります。
(コンテナ作成時のelastiflow_flow_compose.ymlだけでなく、/etc/elastiflow/flowcoll.ymlで設定できるようになります。)
…はずなのですが、RHEL9ではflow-collectorのコンフィグが/etc/flowcoll.ymlと指定されているせいか、/etc/elastiflow/flowcoll.ymlを読んでくれないようです。
そのため以下の手順を実施しても、RHEL9ではelastiflow_flow_compose.ymlで設定する必要があります。(Debian/Ubuntu未確認)
※/etc/elastiflowディレクトリ自体は各種ファイルの保存場所として使うので、手順自体は実施しておきます。
# pwd
/root/elastiflow
# mkdir elastiflow_extracted
# wget https://elastiflow-releases.s3.us-east-2.amazonaws.com/flow-collector/flow-collector-7.10.0-1.x86_64.rpm
# rpm2archive flow-collector-7.10.0-1.x86_64.rpm
# tar xzf flow-collector-7.10.0-1.x86_64.rpm.tgz -C elastiflow_extracted
# mkdir /etc/elastiflow
# cp -r elastiflow_extracted/etc/elastiflow/. /etc/elastiflow
SELinux対応
elastiflow_flow_compose.ymlを修正し、コンテナがマウントするディレクトリをSELinux対応にします。
volumesの各行の末尾に、:zフラグを追記します。
volumes:
- /etc/elastiflow:/etc/elastiflow:z
- /var/log/elastiflow:/var/log/elastiflow:z
- /var/lib/elastiflow/flowcoll:/var/lib/elastiflow/flowcoll:z
ディレクトリ作成と所有権の修正
コンテナがマウントするディレクトリを作成し、所有者をコンテナの実行ユーザ(UID:1000)が読み書きできるようにします。
# mkdir -p /var/log/elastiflow/flowcoll /var/lib/elastiflow/flowcoll
# chown -R 1000:1000 /var/log/elastiflow /var/lib/elastiflow
コンテナ作成
docker composeでコンテナを作成します。
# pwd
/root/elastiflow
# docker compose -f elasticsearch_kibana_compose.yml -f elastiflow_flow_compose.yml up -d
(..snip..)
[+] Running 8/8
 ✔ Network elastiflow_default      Created           0.1s
 ✔ Volume "elastiflow_esdata01"    Created           0.0s
 ✔ Volume "elastiflow_kibanadata"  Created           0.0s
 ✔ Volume "elastiflow_certs"       Created           0.0s
 ✔ Container elastiflow-setup-1    Healthy          26.8s
 ✔ Container flow-collector        Started          23.2s
 ✔ Container elastiflow-es01-1     Healthy          35.0s
 ✔ Container elastiflow-kibana-1   Started          35.2s
# docker container ls
CONTAINER ID   IMAGE                                                  COMMAND                   CREATED          STATUS                    PORTS                                                   NAMES
08182fab7839   docker.elastic.co/kibana/kibana:8.16.4                 "/bin/tini -- /usr/l…"   17 minutes ago   Up 17 minutes (healthy)   0.0.0.0:5601->5601/tcp, [::]:5601->5601/tcp             elastiflow-kibana-1
daf770ed9bcc   docker.elastic.co/elasticsearch/elasticsearch:8.16.4   "/bin/tini -- /usr/l…"   17 minutes ago   Up 17 minutes (healthy)   0.0.0.0:9200->9200/tcp, [::]:9200->9200/tcp, 9300/tcp   elastiflow-es01-1
da240bcf3f3d   elastiflow/flow-collector:7.7.2                        "/bin/sh -c $BINARY_…"   18 minutes ago   Up 17 minutes                                                                     flow-collector
docker composeした後しばらくして、Container elastiflow-setup-1、flow-collector、elastiflow-es01-1、elastiflow-kibana-1の4つに対して、HealthyやStartedと表示されれば正常に起動しています。
Kibana、Elasticsearchの起動には時間が掛かります。
起動が完了したことを確認するためには、docker container lsを実行して、STATUSがhealthyと表示されるまで待ちましょう。
Elasticsearch、Kibanaのパスワード変更
初期パスワードは単純なものであるため、パスワードを変更しておくべきでしょう。
.envファイルを開いて、ELASTIC_PASSWORD、KIBANA_PASSWORDを修正した後、コンテナを再作成します。
コンテナの再起動は、docker compose downで一度停止し、docker compose up -dで改めて起動し直します。
コンテナを再作成しても、データは保持されています。
# pwd
/root/elastiflow
# vim .env
(Change below lines)
ELASTIC_PASSWORD=elastic
KIBANA_PASSWORD=elastic
# docker compose -f elasticsearch_kibana_compose.yml -f elastiflow_flow_compose.yml down
# docker compose -f elasticsearch_kibana_compose.yml -f elastiflow_flow_compose.yml up -d
Kibanaにダッシュボードの追加
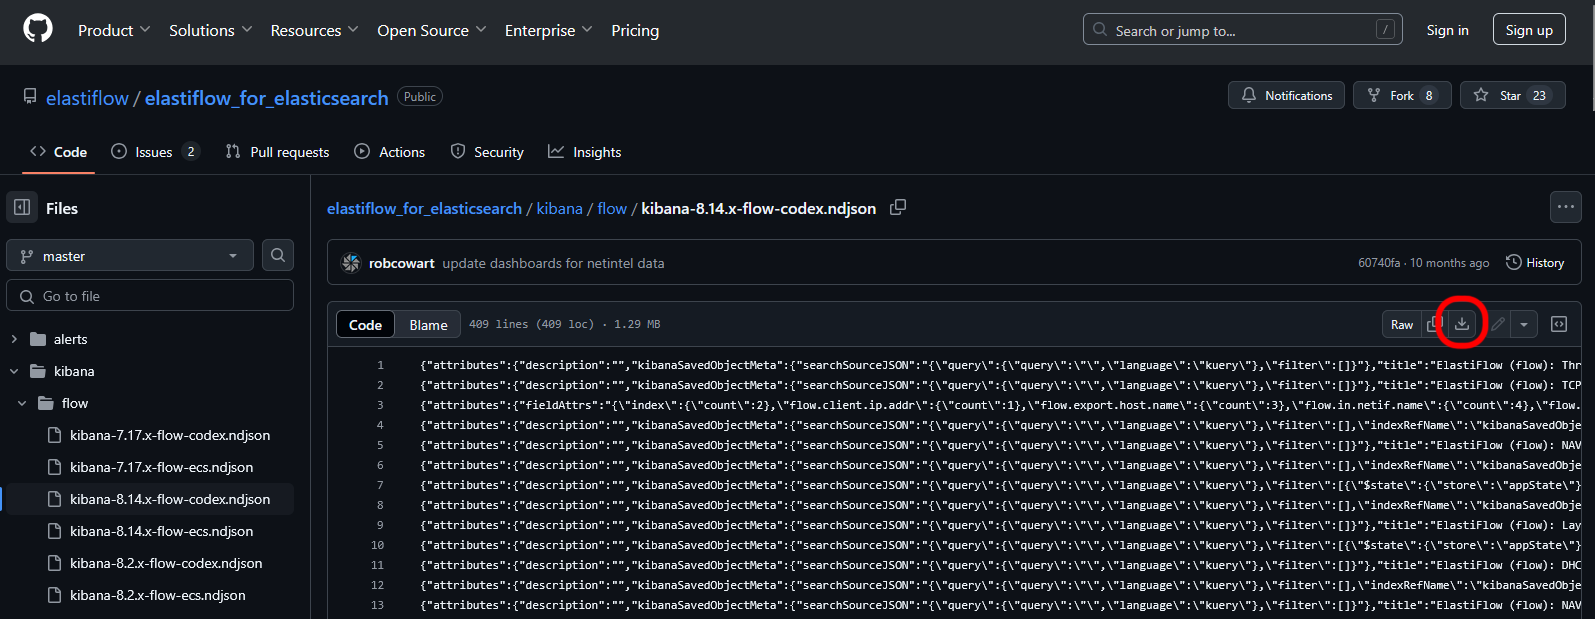
ダッシュボードファイルを手元のPCへダウンロードします。
上記のページを表示した後、ダウンロードボタンからダウンロードできます。
Kibanaにログインして、ElastiFlow NetObservダッシュボードを追加します。
https://<サーバのIP/ホスト名>:5601/ に接続します。
ユーザ名はelastic、パスワードは上記で設定したもの(未変更ならelastic)でログインします。
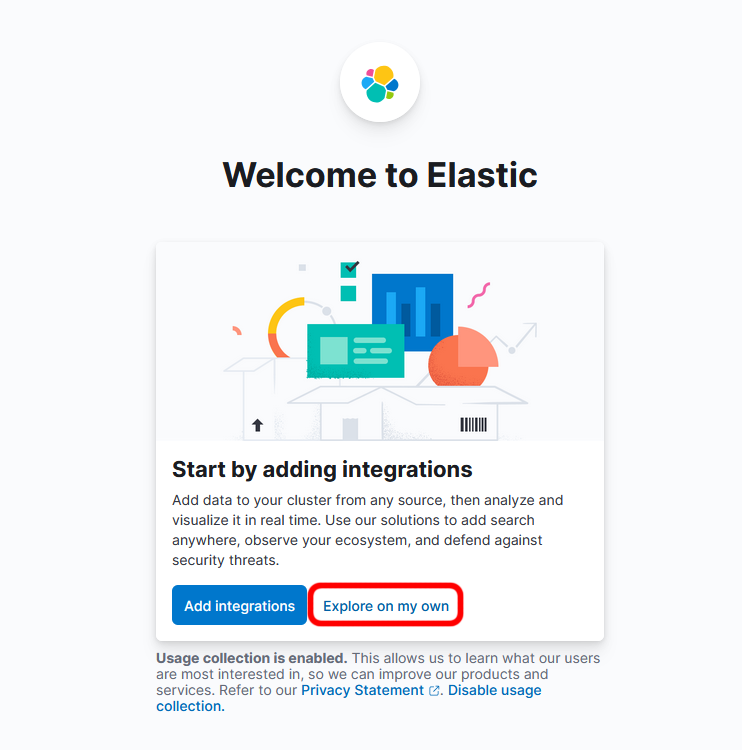
初回ログイン時は、以下の様に表示されるので、「Explorer on my own」を選択します。
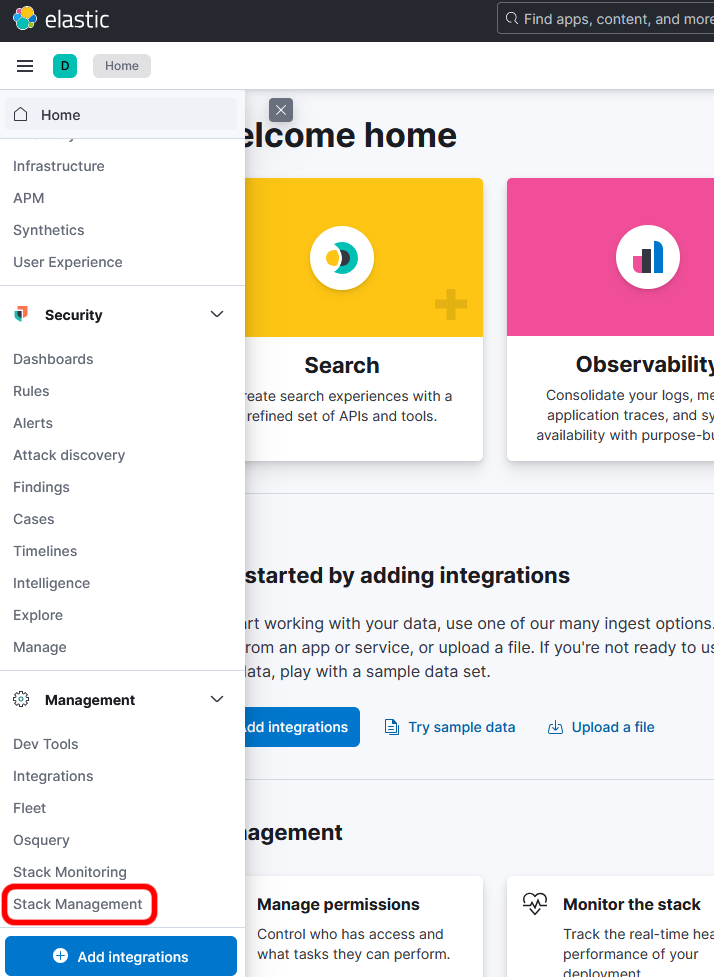
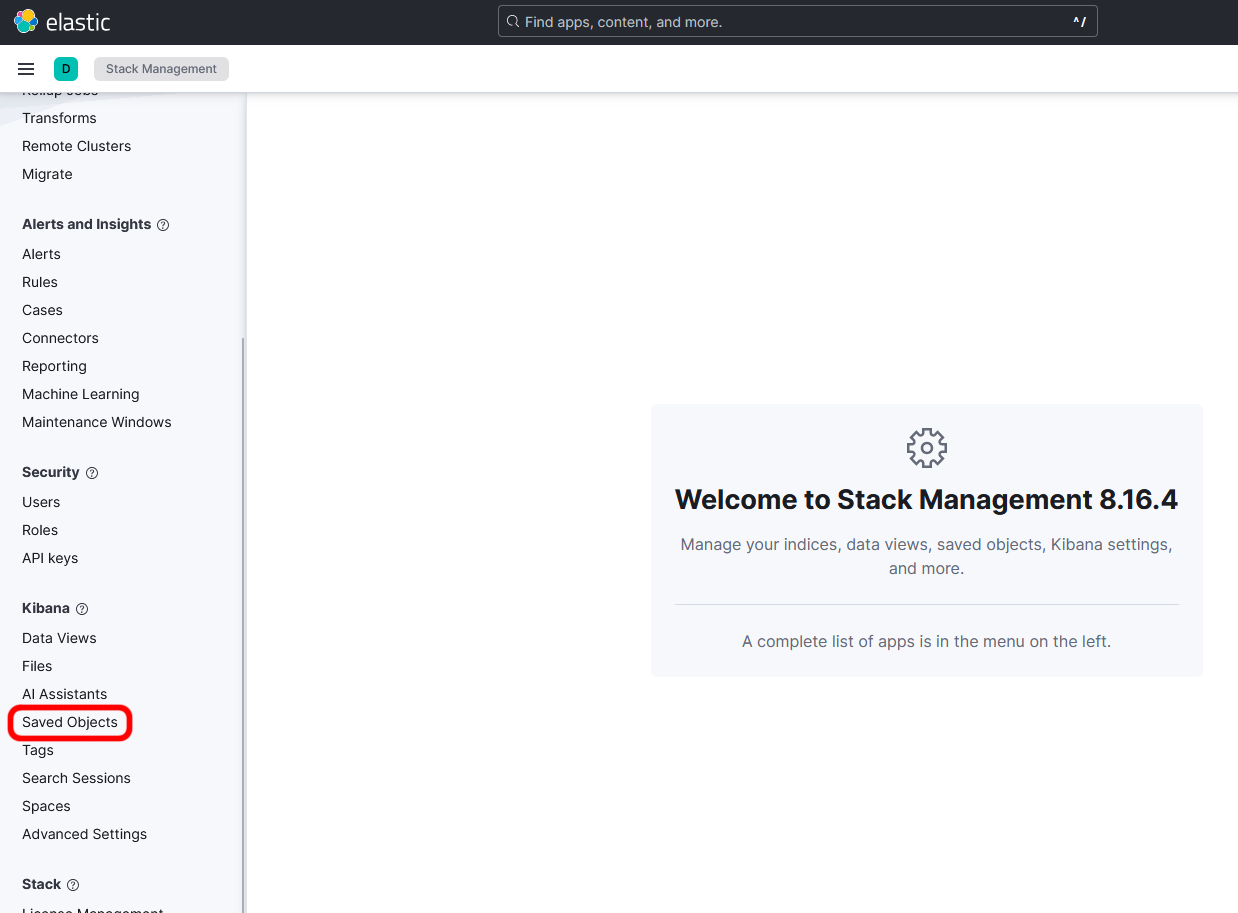
サイドメニューの最下部にある「Stack Management」を開きます。
サイドメニューの「Kibana」配下にある「Saved Objects」を開きます。
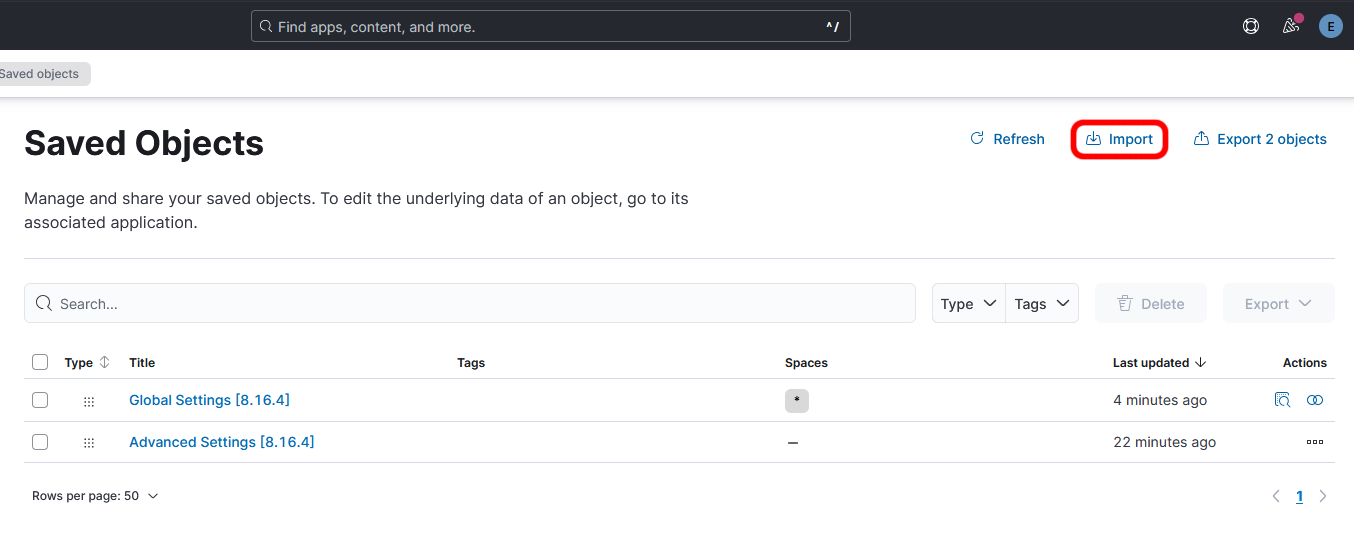
右上の「Import」を選択します。
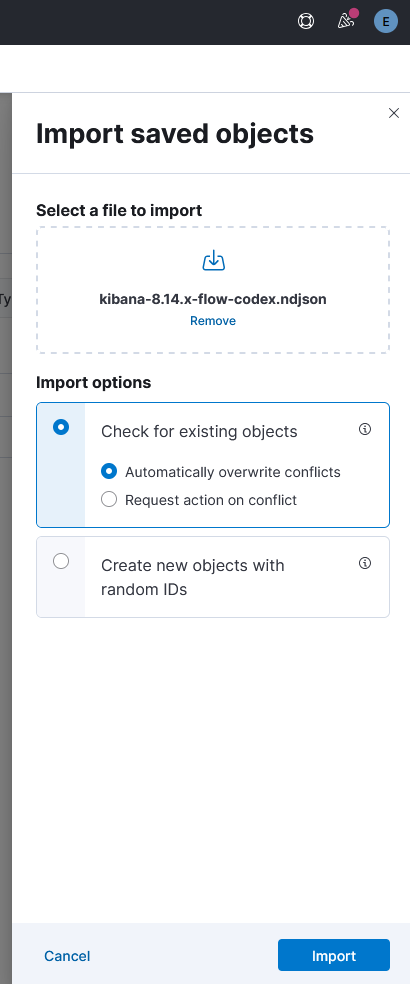
先ほどダウンロードしたファイルを「Select a file to import」の枠にドラッグ&ドロップし、「Import」を選択してインポートします。
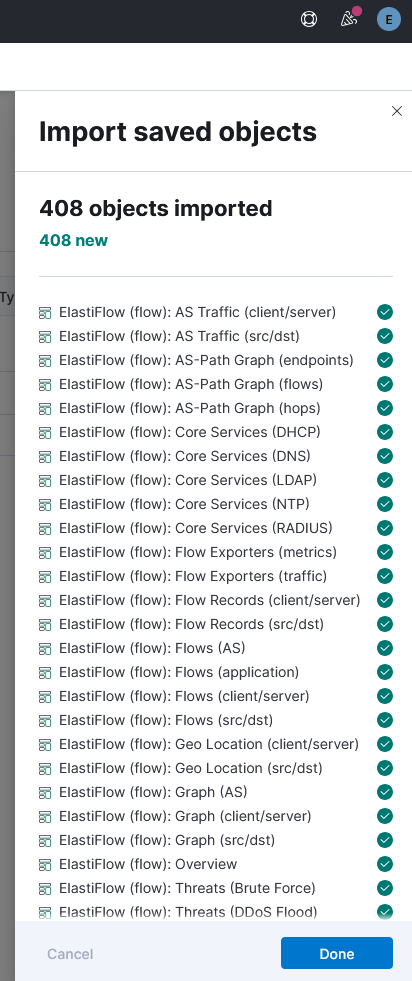
インポートが完了すれば以下の様に表示されます。
VyOS 1.4でsFlowフロー情報の送信
今回は自宅で利用しているVyOSからsFlowでフロー情報を送信し、ElastiFlowで可視化できるようにします。
# set system sflow agent-address <送信元IPアドレス>
# set system sflow agent-interface <送信元インターフェース>
# set system sflow interface <監視対象インターフェース>
# set system sflow server <ElastiFlowサーバIPアドレス> port 9995
# commit
# save
ElastiFlowの表示
Kibanaのトップページへ戻り、サイドメニューの「Analytics」配下にある「Dashboards」を開きます。
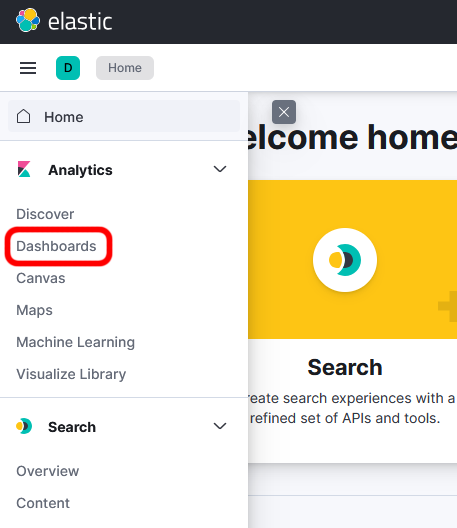
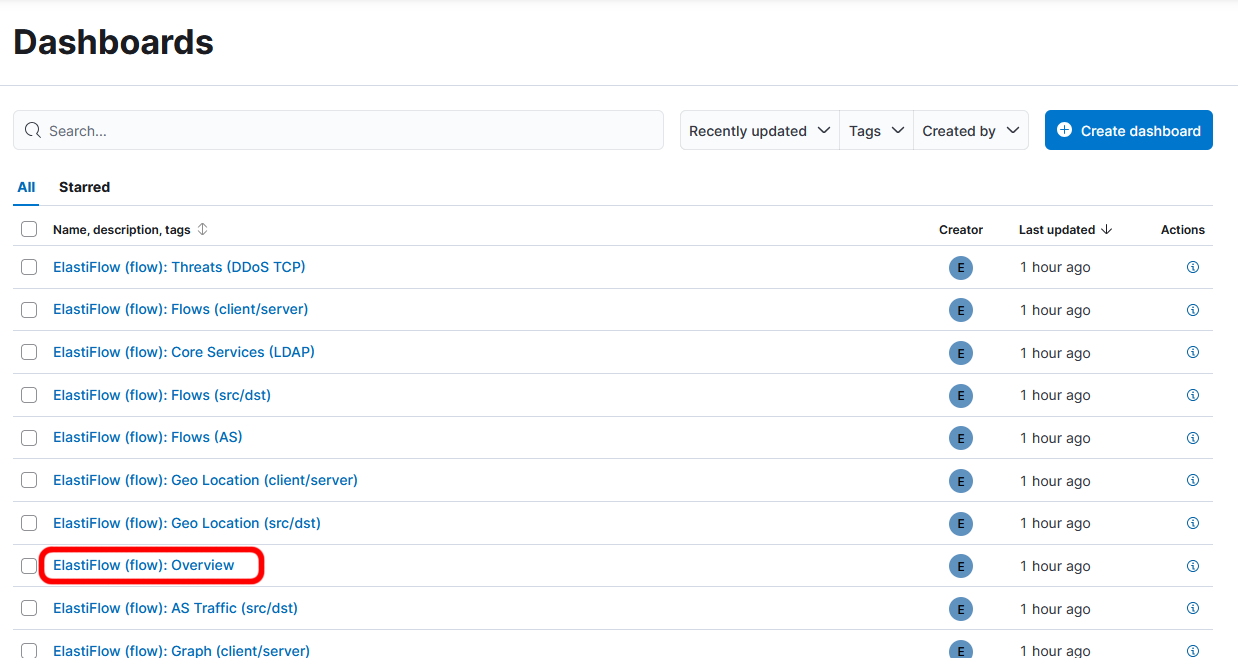
「ElastiFlow (flow): Overview」を開きます。
無事、以下の様にダッシュボードが表示されました。
まとめ
今回は最低減の可視化を行いましたが、地理情報など追加することでさまざまな可視化できるようになります。
それについては、気が向いたら追加で紹介するかもしれません。


最近のコメント